
Smart Agrometer New name – changing step by step PlantSpectra
Log in Order

Product

Device, algorithm and portal

Clip the leaf, press the button – the portal shows which of 12 nutrients is missing and what to add to the sprayer. For winter and spring wheat, barley and maize.

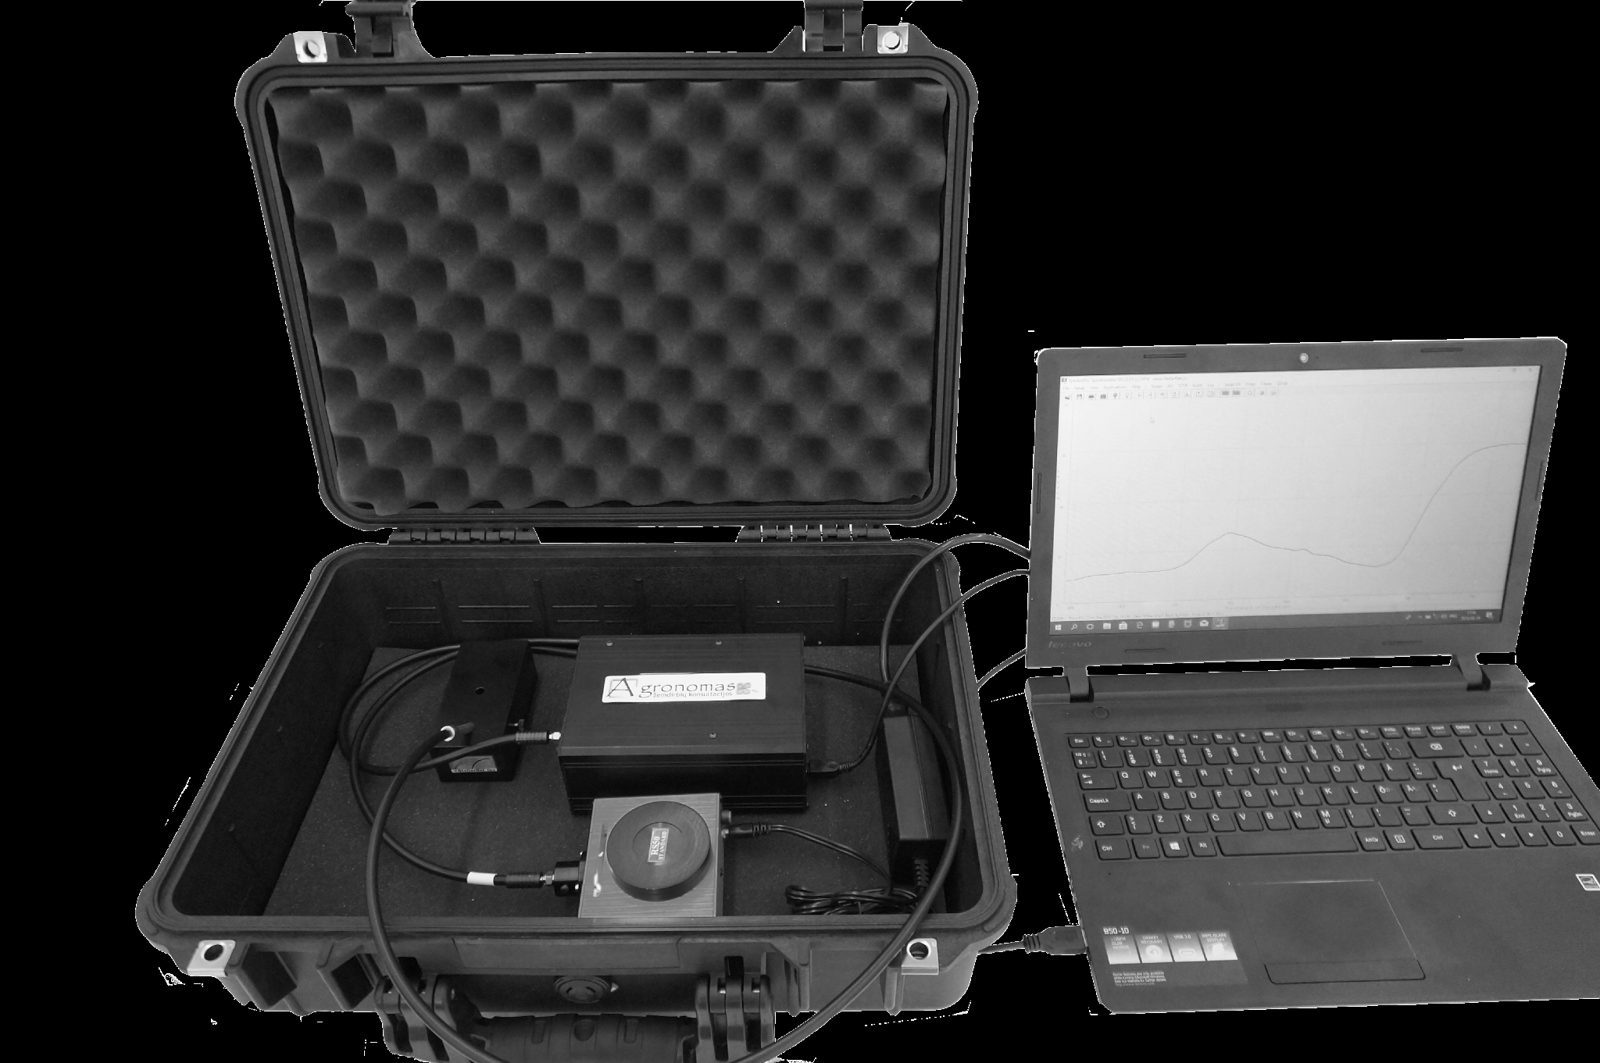
SmartAgrometer handheld spectrophotometer

How it works

1

Up to 10 measurements per 5 hectares

Clip the leaf with the device and press the button.

The first time
You get to know your fields: 500–1000 ha are measured thoroughly in a day, even in awkward fields.
Next times
Using the map from the first measurements, you measure only at the recommended spots, so it takes several times less time. What it looks like ↓
2

Data are sent automatically

Measurements go straight to your portal. Nothing to copy by hand or send to a laboratory.

3

You know what to do

You see which element is missing and you know what to do. A micronutrient deficiency can be corrected quickly with a foliar spray. Macronutrient reserves can be topped up by spraying, but the plant takes them up mainly through its roots, so the soil condition matters. If the soil has enough and only drought is limiting uptake, foliar feeding will make up the shortfall for a few days or weeks. If the soil is short of them, foliar feeding alone will not fix the problem, but the extra yield often still pays for the spraying.
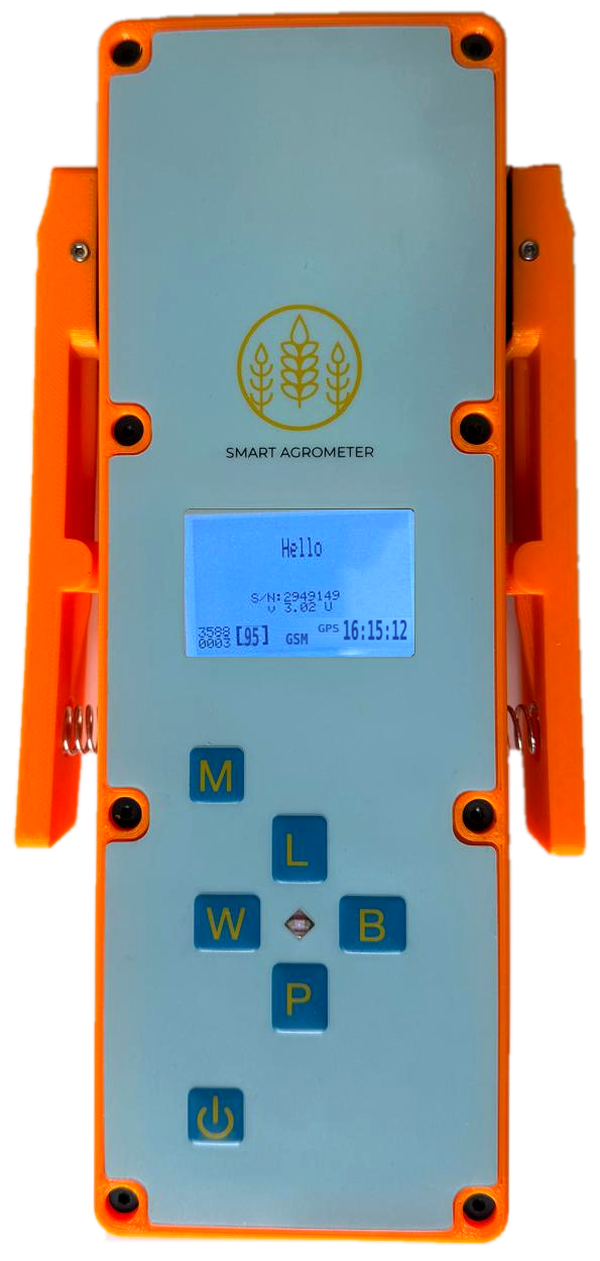
Hello
S/N:123456789
v 3.02.04 U
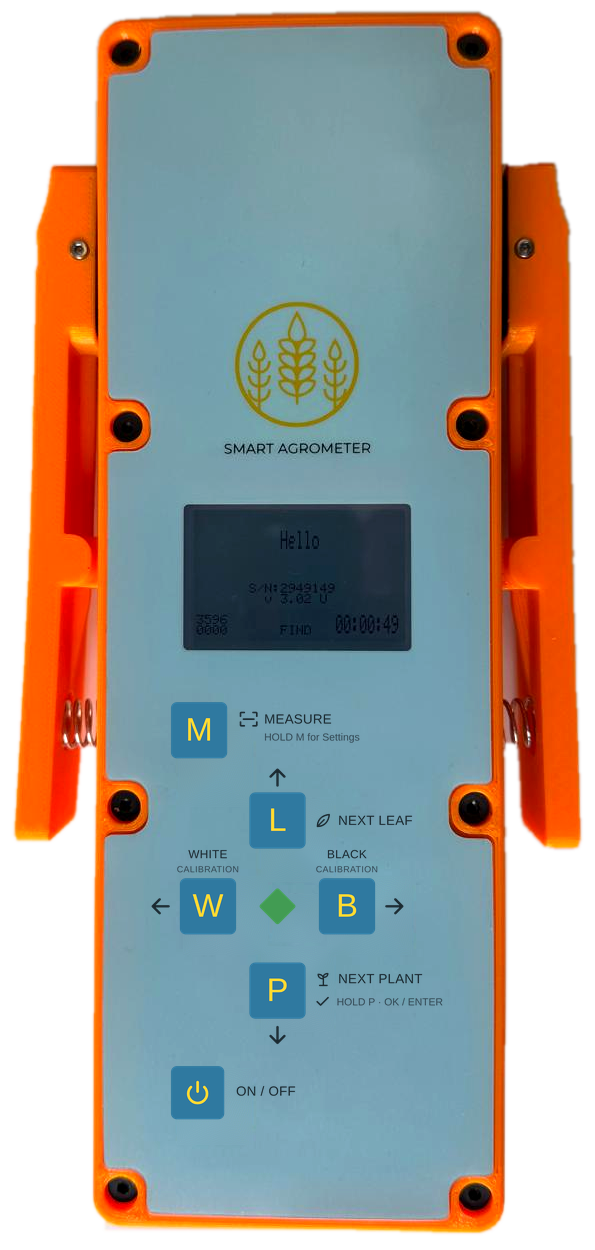
Calibration. W – with the white plates, B – without the plates (the inside of the clip is black). Any order.

Short press – click; long press – hold for ~1 s. Glowing buttons are the ones you can press now.

Interactive menu

Try the device right here

Press the device buttons. Short press – click; long press – hold the button for ~1 s. The screen shows exactly what you will see in the field.

  1. 0. Calibration
  2. 1. Session
  3. 2. Field
  4. 3. Crop
  5. 4. Stage
  6. 5. Signs
  7. 6. Measuring
What the screen shows

The device is on. Before measuring it must be calibrated twice (in any order): W – insert the white plates and press W (white calibration); B – without the plates press B (black calibration, the inside of the clip is black). Only after both calibrations is it clear whether the device will measure accurately (e.g. whether the measuring tip is dirty). Then hold P for ~1 s to enter the measurement information and measure.

What is shown on the screen
Hello
Greeting – the device is on.
S/N:123456789
Device serial number.
v 3.02.04 U
Software version (U – farmer version).
3596 / 0001
Technical device data.
[95]
Battery charge indicator (while charging shows [+nn]).
FIND
FIND – the device is searching for a mobile network. Once connected, GSM, LTE or 3G is shown instead of FIND. When three upward arrows (↑↑↑) are shown, data is being sent to the portal.
zzz
zzz – the device is searching for a GPS signal. When GPS is shown instead of zzz, the GPS signal has been found.
00:00:00
Time since the device was switched on. Once GPS is found, the real time is shown.
Where you can go next

After the first measurements – a map for every nutrient

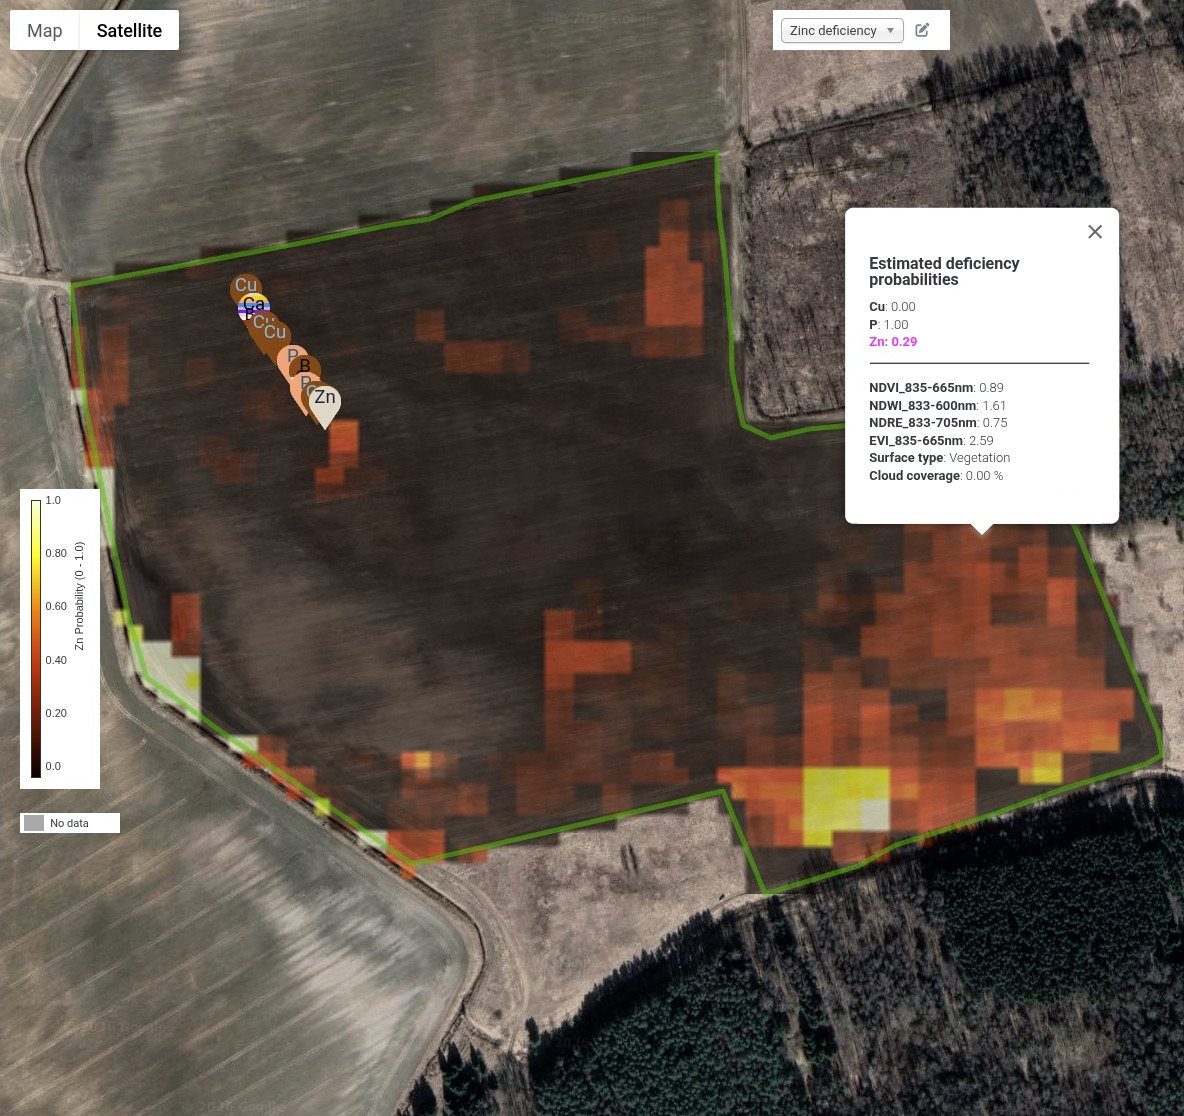
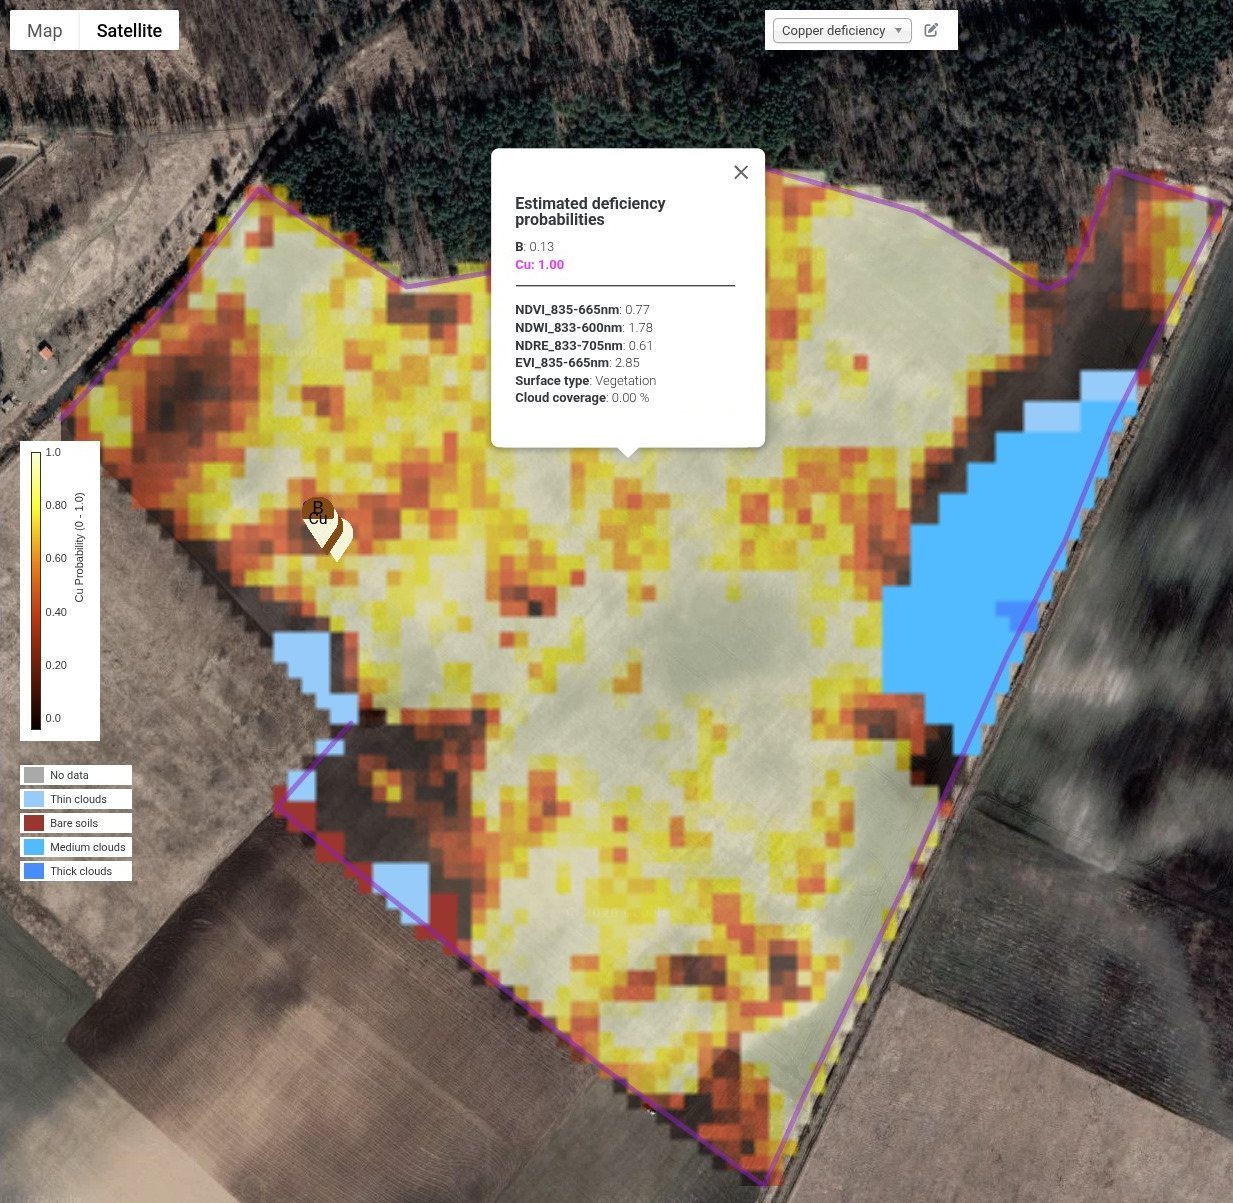
After analysing the measurements, we provide a field map divided by the probability of each nutrient's deficiency. Later measurements are planned from it: we recommend measuring at the specific spots where the probability of deficiency is highest.
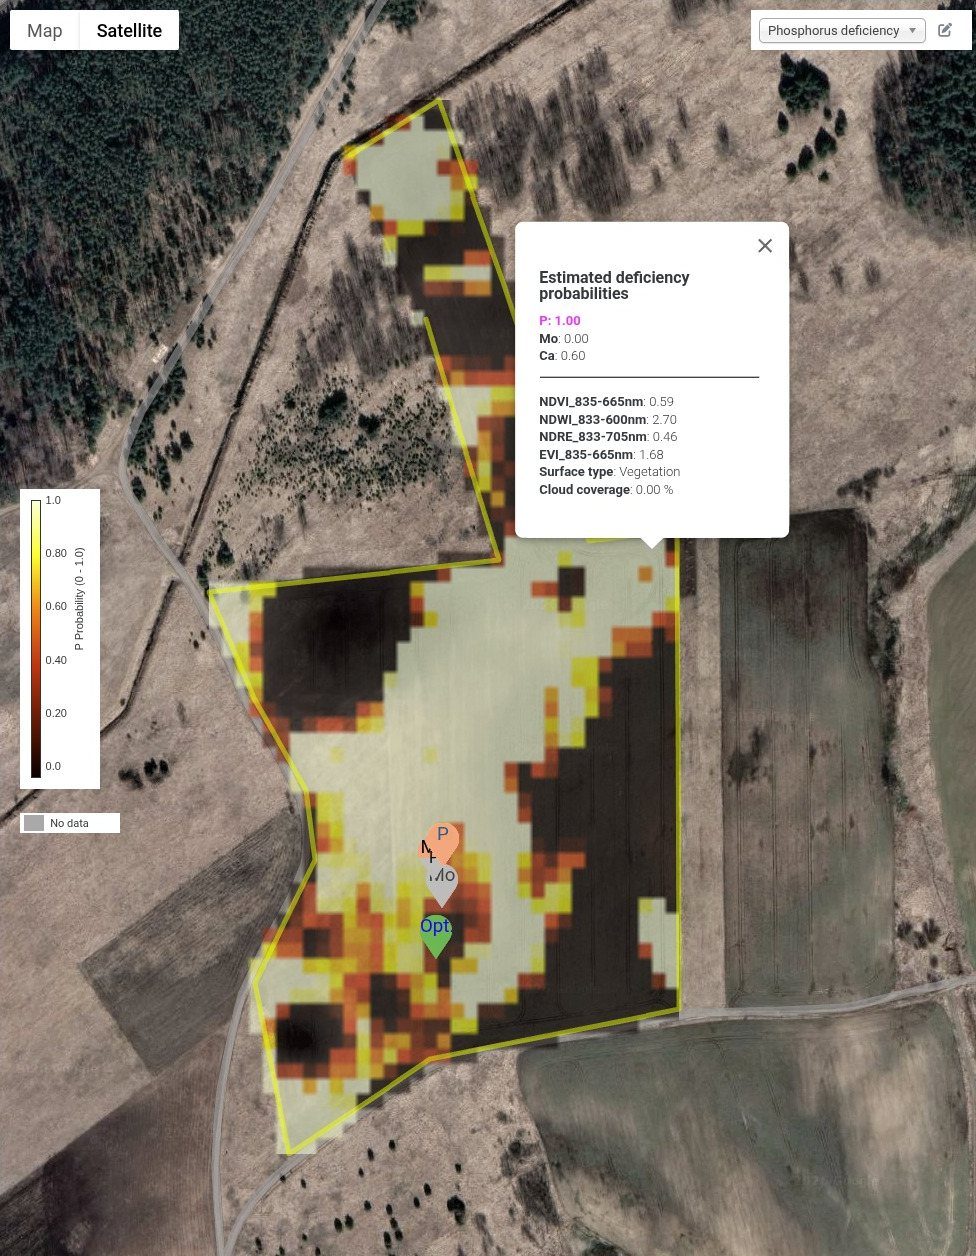
Field map: probability of phosphorus deficiency
Phosphorus (P)
Field map: probability of copper deficiency
Copper (Cu)
Field map: probability of zinc deficiency
Zinc (Zn)

Lighter colour – higher probability of deficiency (0–1). Real portal screens from a farm in Lithuania.
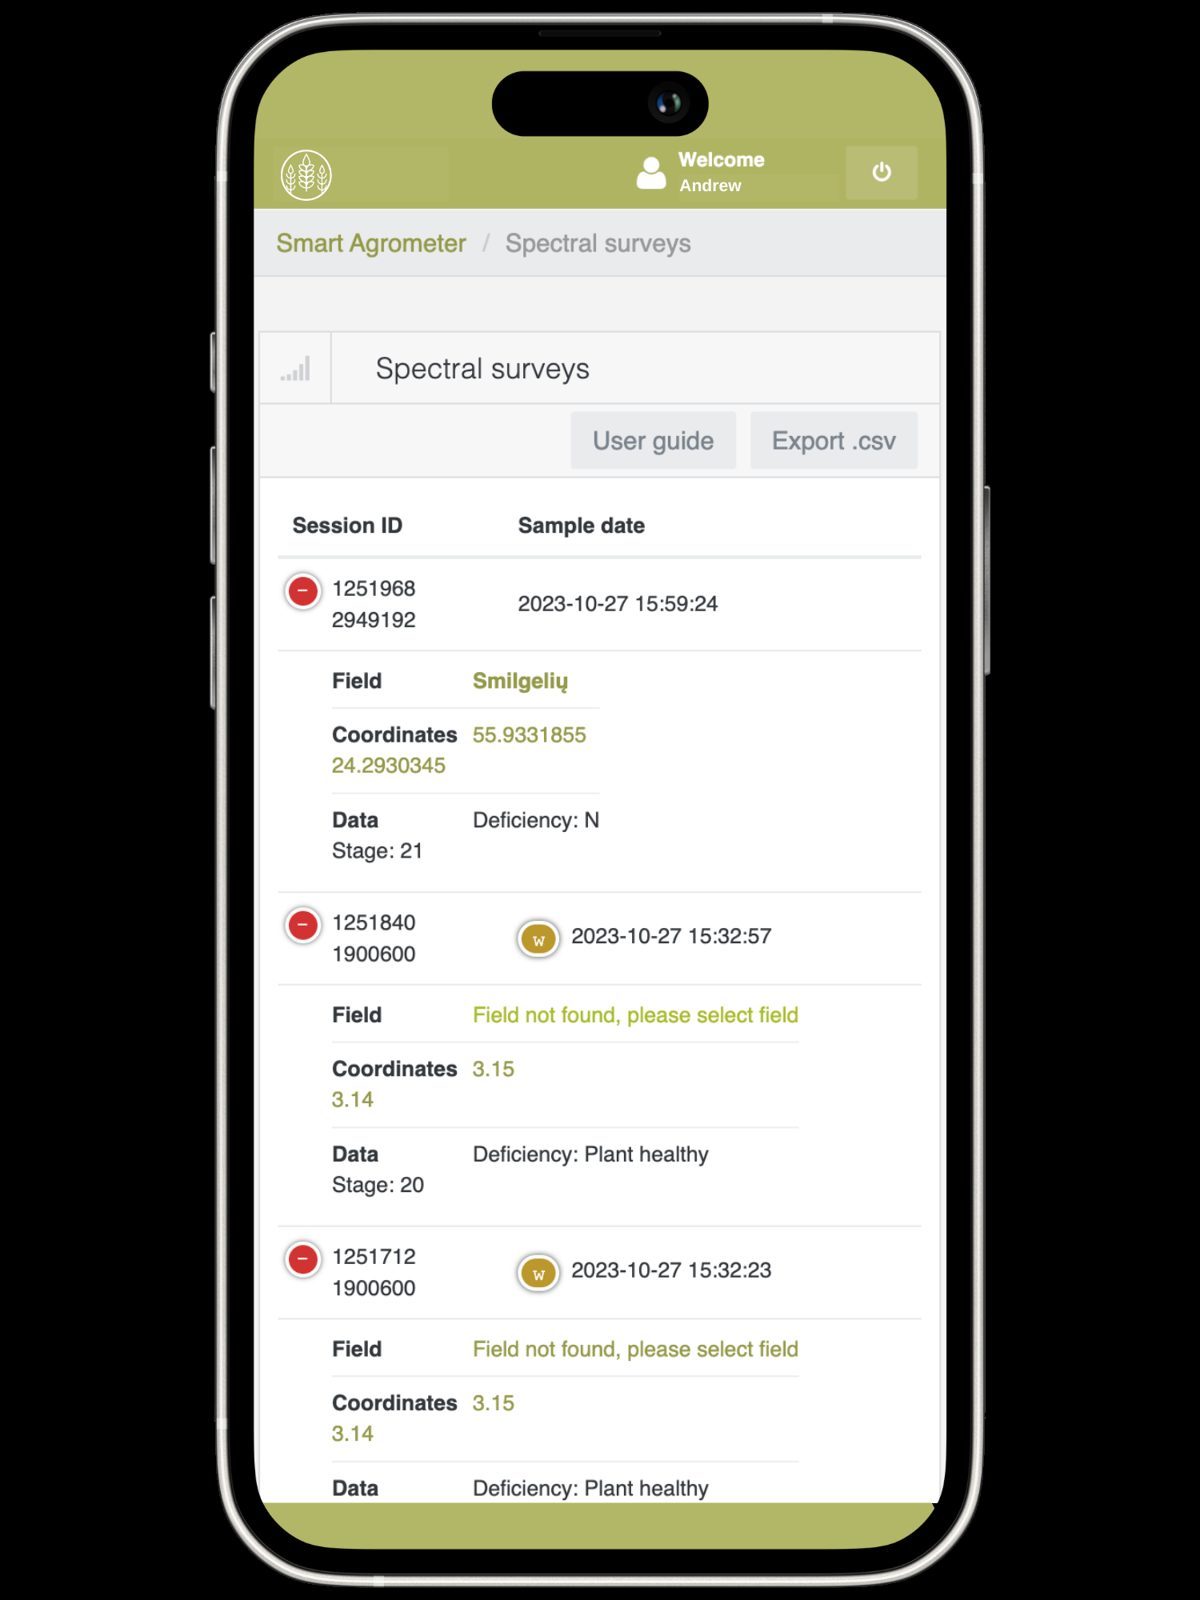
SmartAgrometer app on a phone with measurement sessions
Measurement sessions on the phone
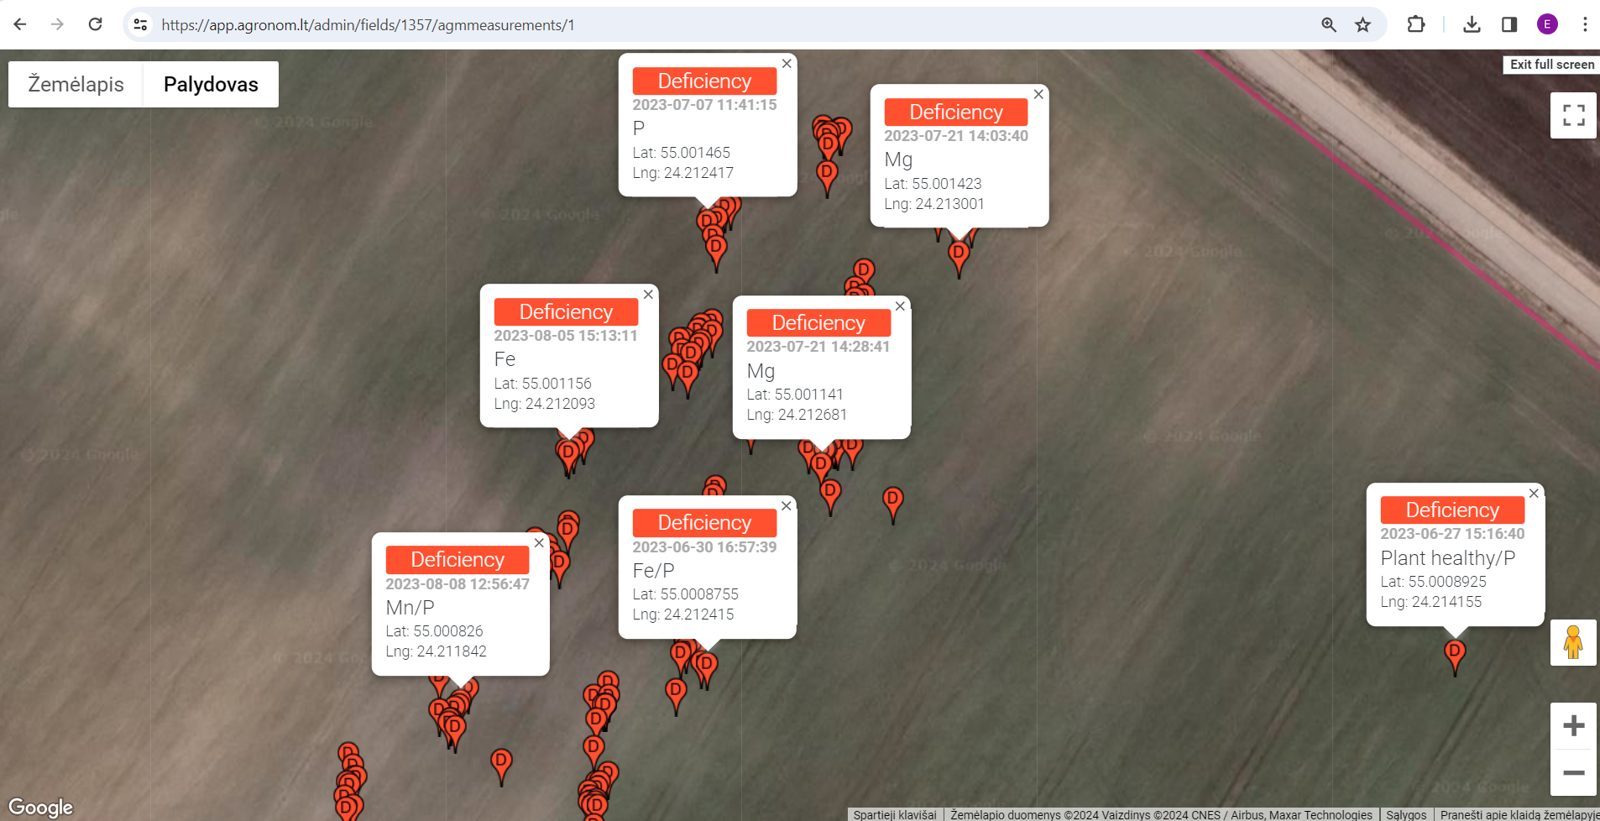
Portal with a field map and measurement points
In the portal you see the measurement points and deficiencies of every field
Watch how SmartAgrometer works
Demo · YouTube

Tech specs

Already used on farms in Lithuania and Latvia and at the University of Tartu in Estonia. On one Lithuanian farm, fertilising according to the measurements raised wheat yield from 7–8 to 9 t/ha over two seasons.

Crops Winter and spring wheat, barley, maize
Nutrients N, P, K, Ca, Mg, S, Fe, Mn, Cu, Zn, Mo, B
Measurements Up to 10 measurements per 5 hectares
Capacity 500–1000 ha per day, later several times faster
Principle Leaf light reflectance spectrum
Calibration White and black reference before work
Protection and certificates IP65 · CE
Result In the user portal, automatically

Price

Prices excl. VAT.

Purchase

1 200 €
device, one-off
+ €1,000 / year
portal and recommendations
First year in total: 2 200 €
After that: €1,000 / year
Order

When will it pay off?

How many hectares of wheat do you grow?

11 kg/ha

of extra yield is enough to pay back the first year (€2,200).

Calculated with a wheat price of €200/t.

Frequently asked questions

A soil test shows how much plant-available nutrients are in the soil, but it does not reveal whether the plant can take them up in sufficient amounts. Temperature, moisture, soil properties and interactions between nutrients can limit uptake, even when the soil holds enough of them.

SmartAgrometer (new name – PlantSpectra) lets you look at it from the plant's side – to find out which nutrient deficiency signs are showing right now, under the current growing conditions.

This way you assess not only what the soil can offer, but also the plant's current nutritional status. The results help you make well-founded crop nutrition decisions in time.

Before work, the device is calibrated using white and black references – this ensures that the spectral measurements are reliable.

The algorithm was trained on data from scientific experiments. Plants were grown under strictly controlled environmental conditions, with their nutrition precisely regulated. In each trial treatment, the supply of only one specific nutrient was deliberately limited, while all other nutrients were supplied according to the plants' needs. This made it possible to reliably identify the spectral changes in plants caused by deficiencies of individual nutrients and to use them to build the diagnostic algorithm.

SmartAgrometer (PlantSpectra) assesses the plant's spectral signs and determines which nutrient is most likely to be deficient.

After additional fertilisation, it is recommended to repeat the measurement and check whether the deficiency signs have disappeared and whether the applied rate was sufficient.

Scientific research on how nutrient deficiencies affect wheat growth and productivity has been published in the peer-reviewed journal Plants (2026).

The first time, 500–1000 ha are measured thoroughly in a day, even in awkward fields. Once the fields have been measured and analysed, later measurements take several times less: a few typical spots are enough, as fields on one farm are usually similar.

Winter and spring wheat, barley and maize.

The portal shows which nutrient is limiting growth and recommends what to add to the sprayer.

Order SmartAgrometer

Choose what you want – to buy or first see a demonstration in your own field. An agronomist will get in touch and answer your questions.

Delivery to Lithuania, Latvia, Estonia and across the EU. Prices excl. VAT.

Want it faster? Call or write:
+370 656 17565

Looking for a dealer in your country? For distributors →

Phone or e-mail is enough – we will call or write back.