

From the lab to the field
The plant itself reveals what it is missing.
A soil test shows which nutrients are available in the soil. But only the plant's condition reflects how it is responding to the current growing conditions.
SmartAgrometer (PlantSpectra) analyses the spectrum of light reflected by the leaves and helps identify signs of deficiency of 12 nutrients – right in the field, in a few seconds.
Our trial
12 nutrients. Can all their deficiencies be seen by eye?
This winter wheat was grown under strictly controlled environmental and nutritional conditions. In each trial treatment, the supply of one specific nutrient was limited, while the availability of all the others was ensured.
Choose a nutrient and compare how its deficiency changed the plant's appearance.
In the field, however, a nutrient deficiency is not always visible to the naked eye. SmartAgrometer (PlantSpectra) analyses the spectrum of light reflected by the leaves and helps identify deficiency signs even before obvious visual symptoms appear.
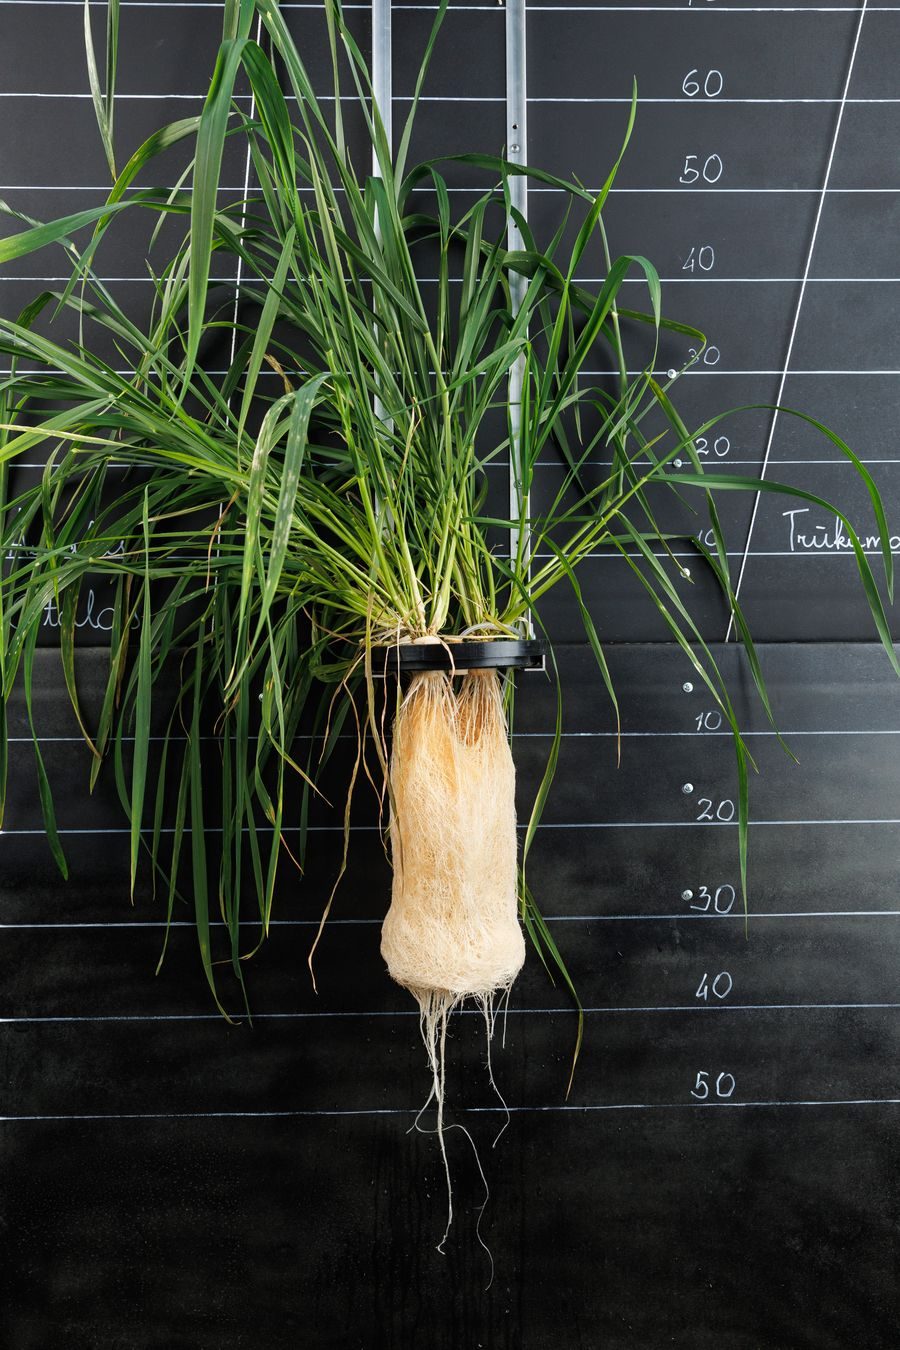
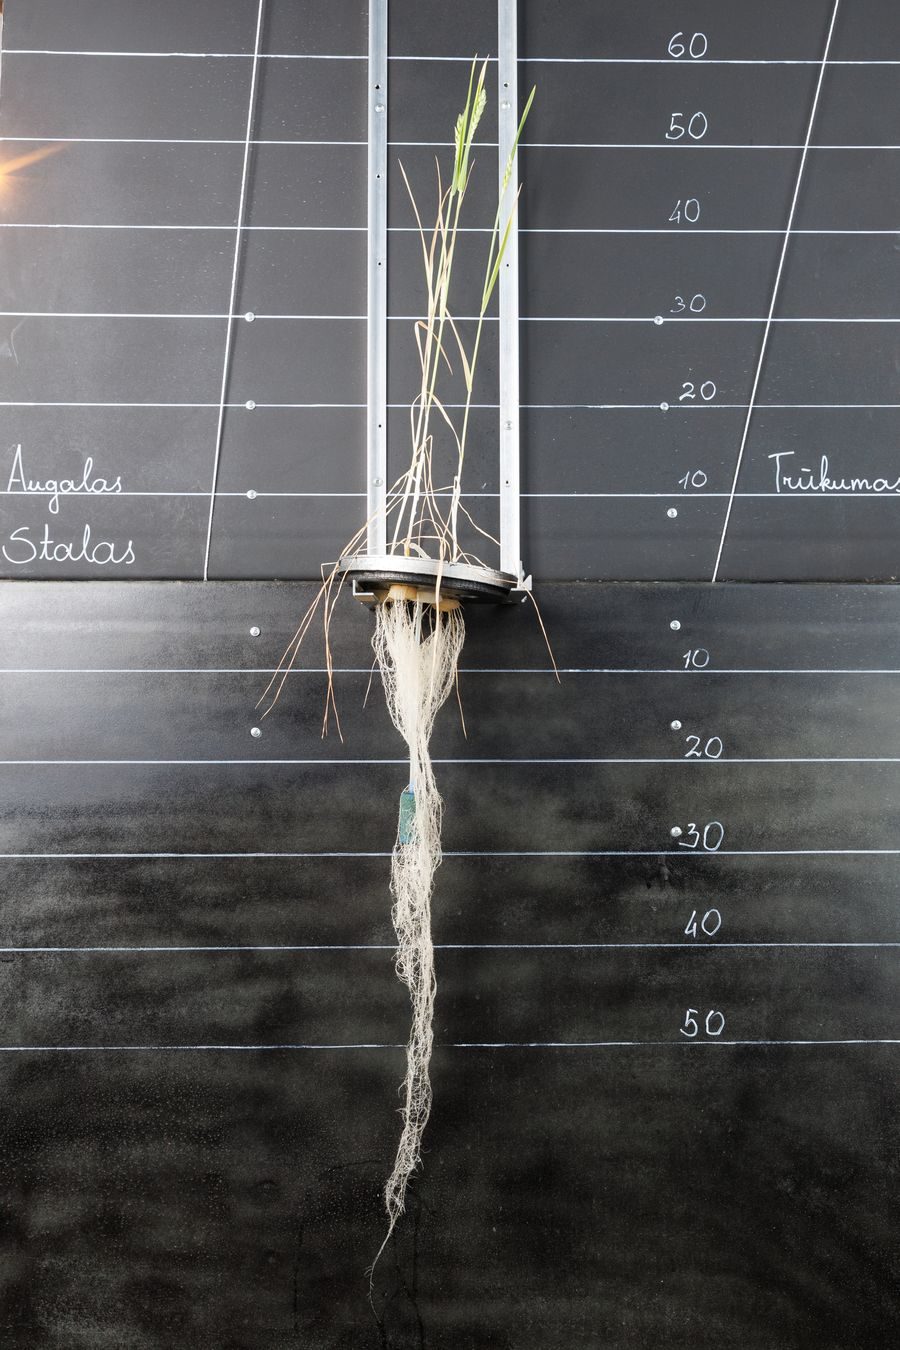
The plant grows more slowly, leaves are pale green or yellowing. Older leaves yellow first – the plant “moves” nitrogen to younger ones. Fewer tillers and ears, smaller grains.
One plant is not a field yet. In the field, such differences are masked by variation in soil, variety and weather, so a measurement shows a deficiency more reliably than the eye.
All 12 nutrients and the study →One system, three parts
The device measures, the algorithm evaluates, the portal tells you what to do.
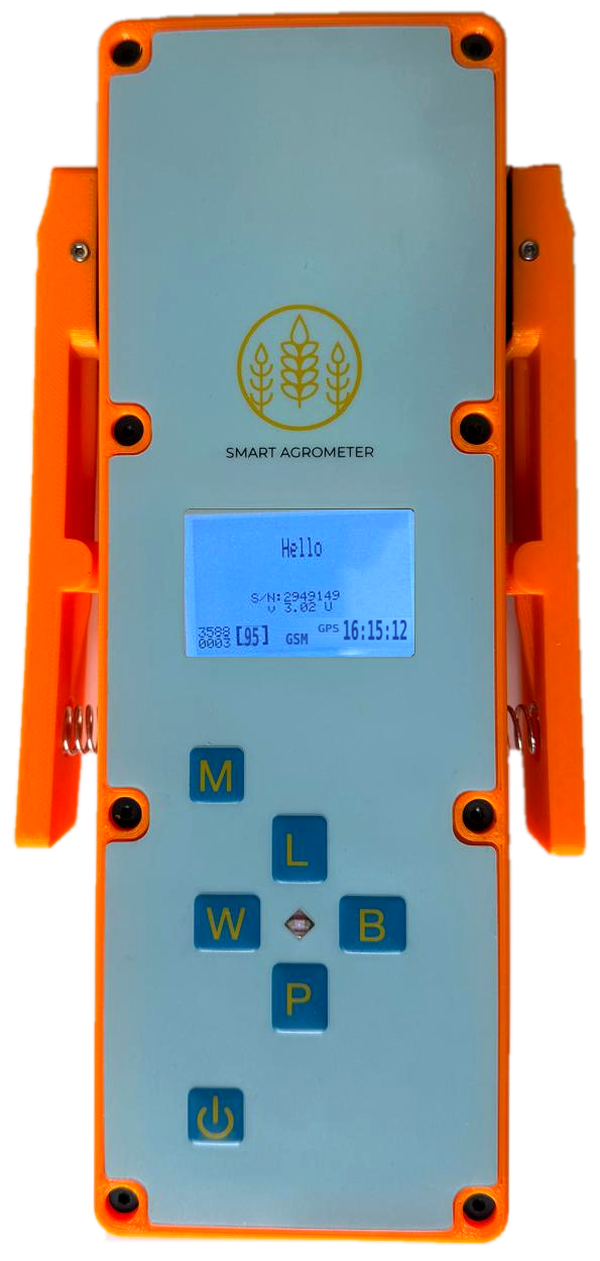
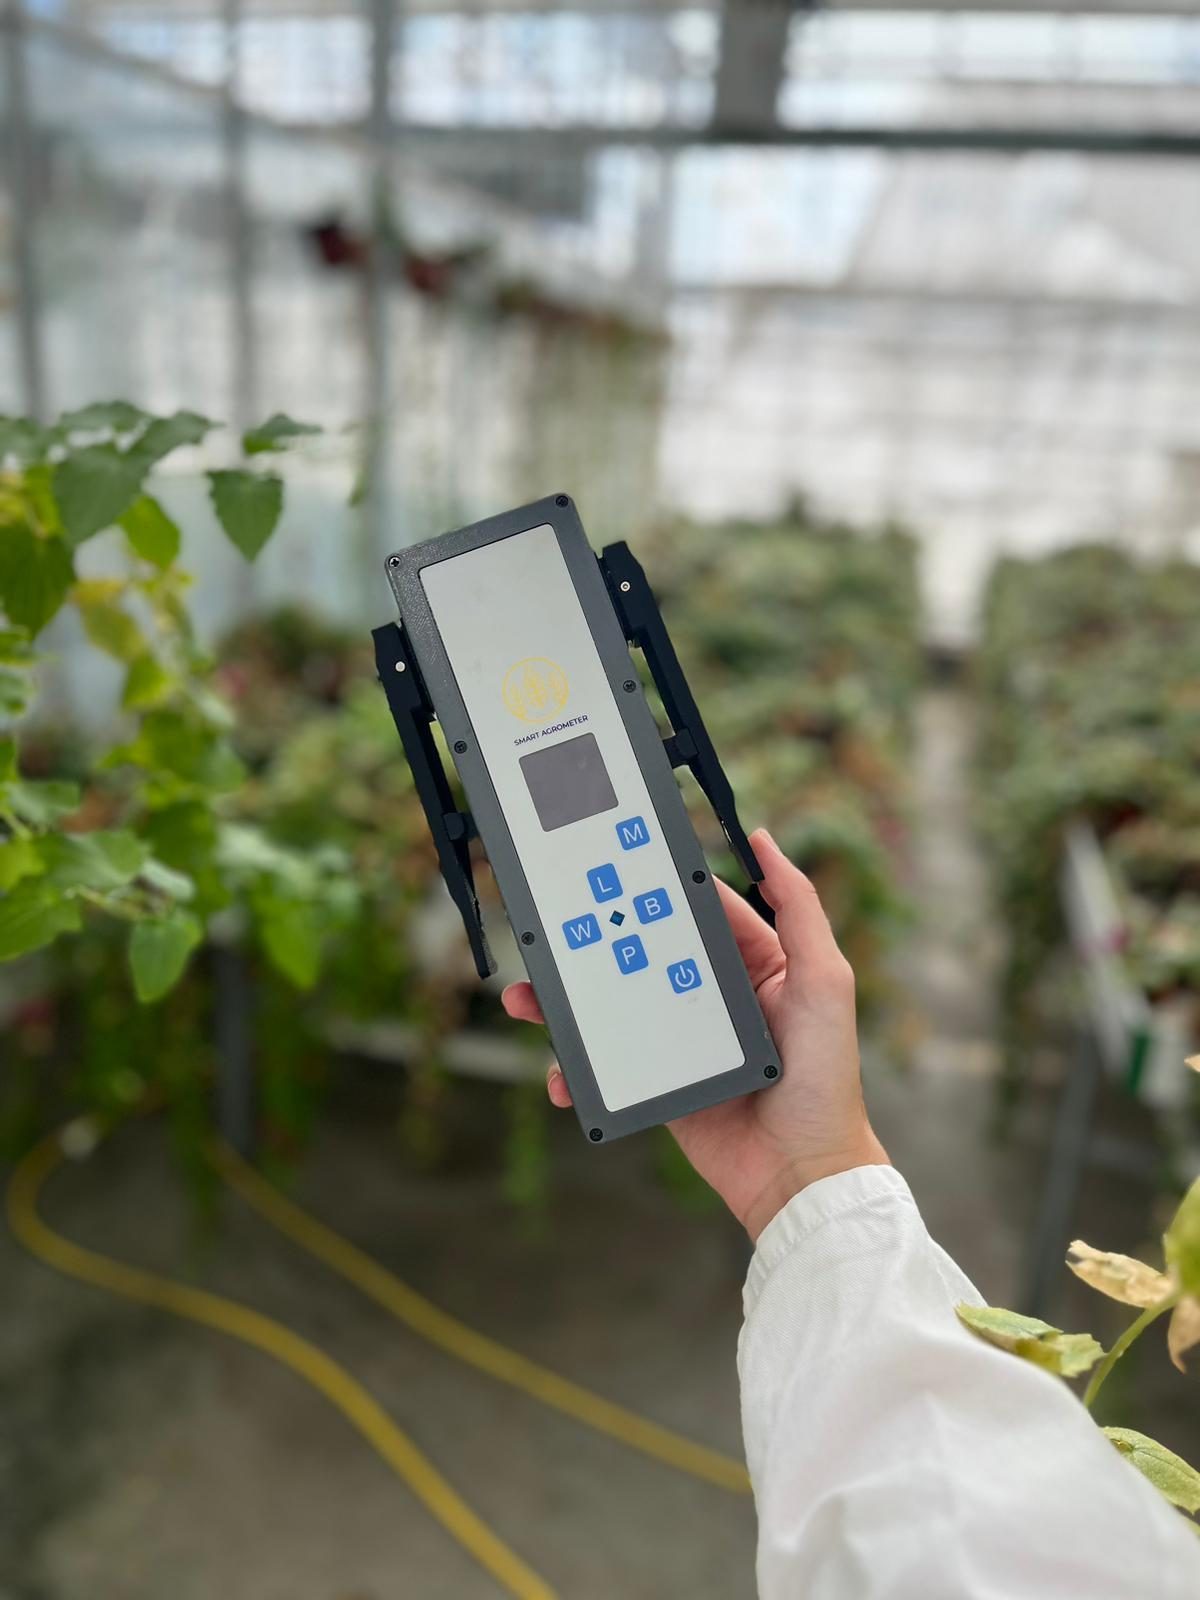
Our own patented handheld spectrophotometer
The leaf is held in a clip and measured with one press of a button. IP65 and CE certified.
Recognises the “signatures” of 12 elements
Each nutrient deficiency leaves its own “signature” in the leaf reflectance spectrum. The algorithm recognises it and shows which of 12 nutrients the plant is missing most.
A recommendation for the sprayer
The farm management system shows what each field is missing and what to add to the sprayer.
Peer-reviewed study · Plants 2026
For a plant, timing matters as much as quantity
In our study, when a nutrient was missing from tillering until growth stages BBCH 30–37, some yield components did not recover even after it was supplied later. In the field, time runs even faster – so a deficiency has to be measured, not waited for until you can see it.
Example result
From measurement to decision
This is what a season with SmartAgrometer looks like – from the field to the agronomist’s recommendation.
-
1
Field
The agronomist walks through the wheat field and measures plant leaves at several points in the field.
-
2
Measuring
In a few seconds the device assesses the leaf. Measurements with GPS coordinates are sent to the portal.
-
3
Decision
In the portal you see a field map: where, and for which element, the probability of deficiency is highest. The agronomist recommends fertilising only with what is missing, and only where it is needed.
-
4
Check
After fertilising, you measure again – so you see whether the deficiency has decreased and you don’t waste money.
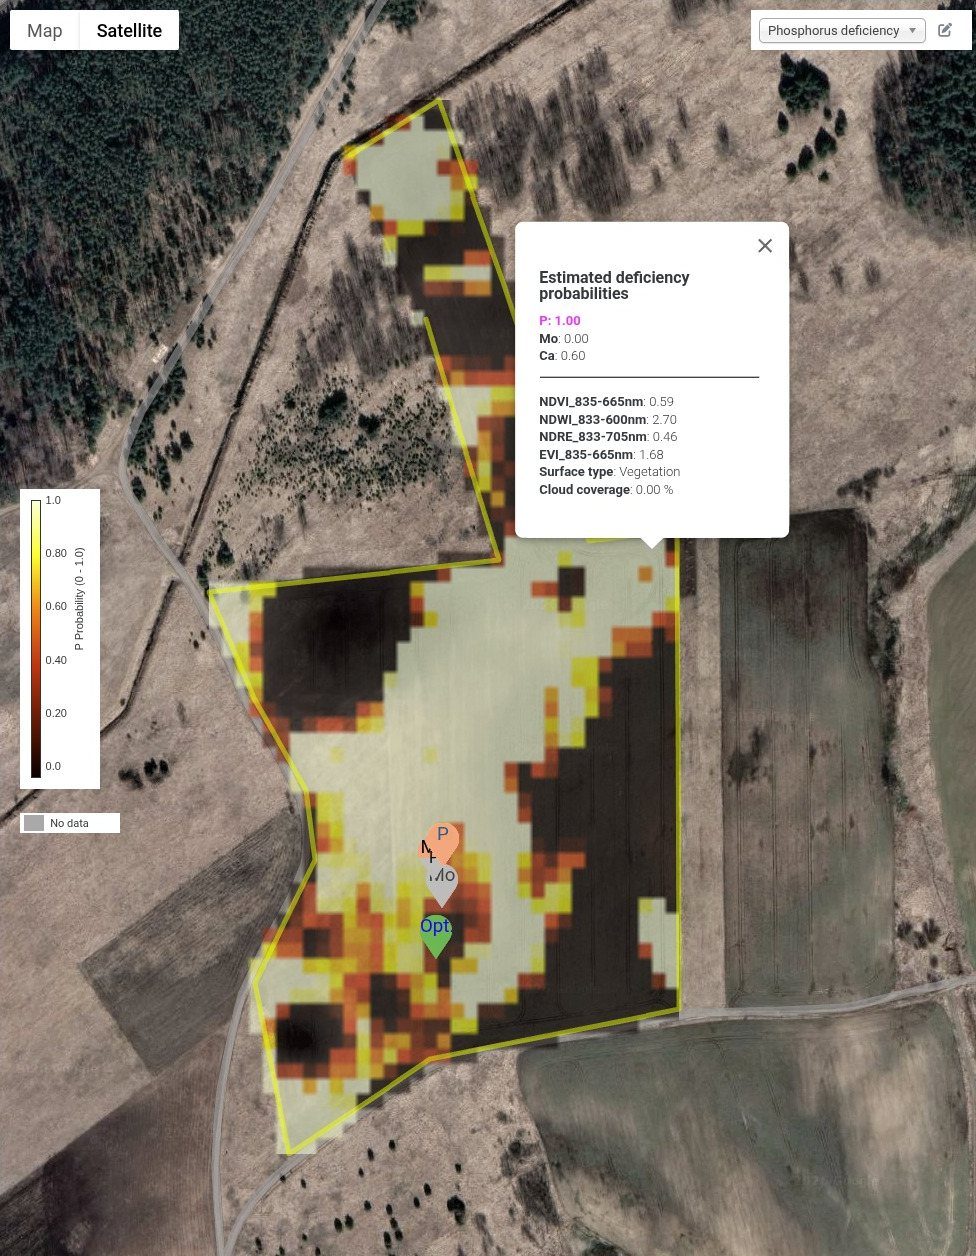
Fertilising according to the measurements, the farm’s wheat yield rose from 7–8 to 9 t/ha over two seasons. Results in each field depend on the soil, the weather and what is actually missing.
Book a demonstrationProven in science and in the field
Nitrogen, phosphorus and calcium deficiency slowed growth the most
A longer deficiency left effects that later fertilisation could no longer fix. That is why it matters not only how much, but also when.
Read the article →Trained in greenhouse trials
The algorithm was trained on measurements from VMU greenhouse trials in which plants were deliberately deprived of one element at a time. This is how it learned to recognise the “signature” of each deficiency.
How we tested →On farms in Lithuania and Latvia, at the University of Tartu
On one Lithuanian farm, fertilising according to the measurements raised wheat yield from 7–8 to 9 t/ha over two seasons.
About us →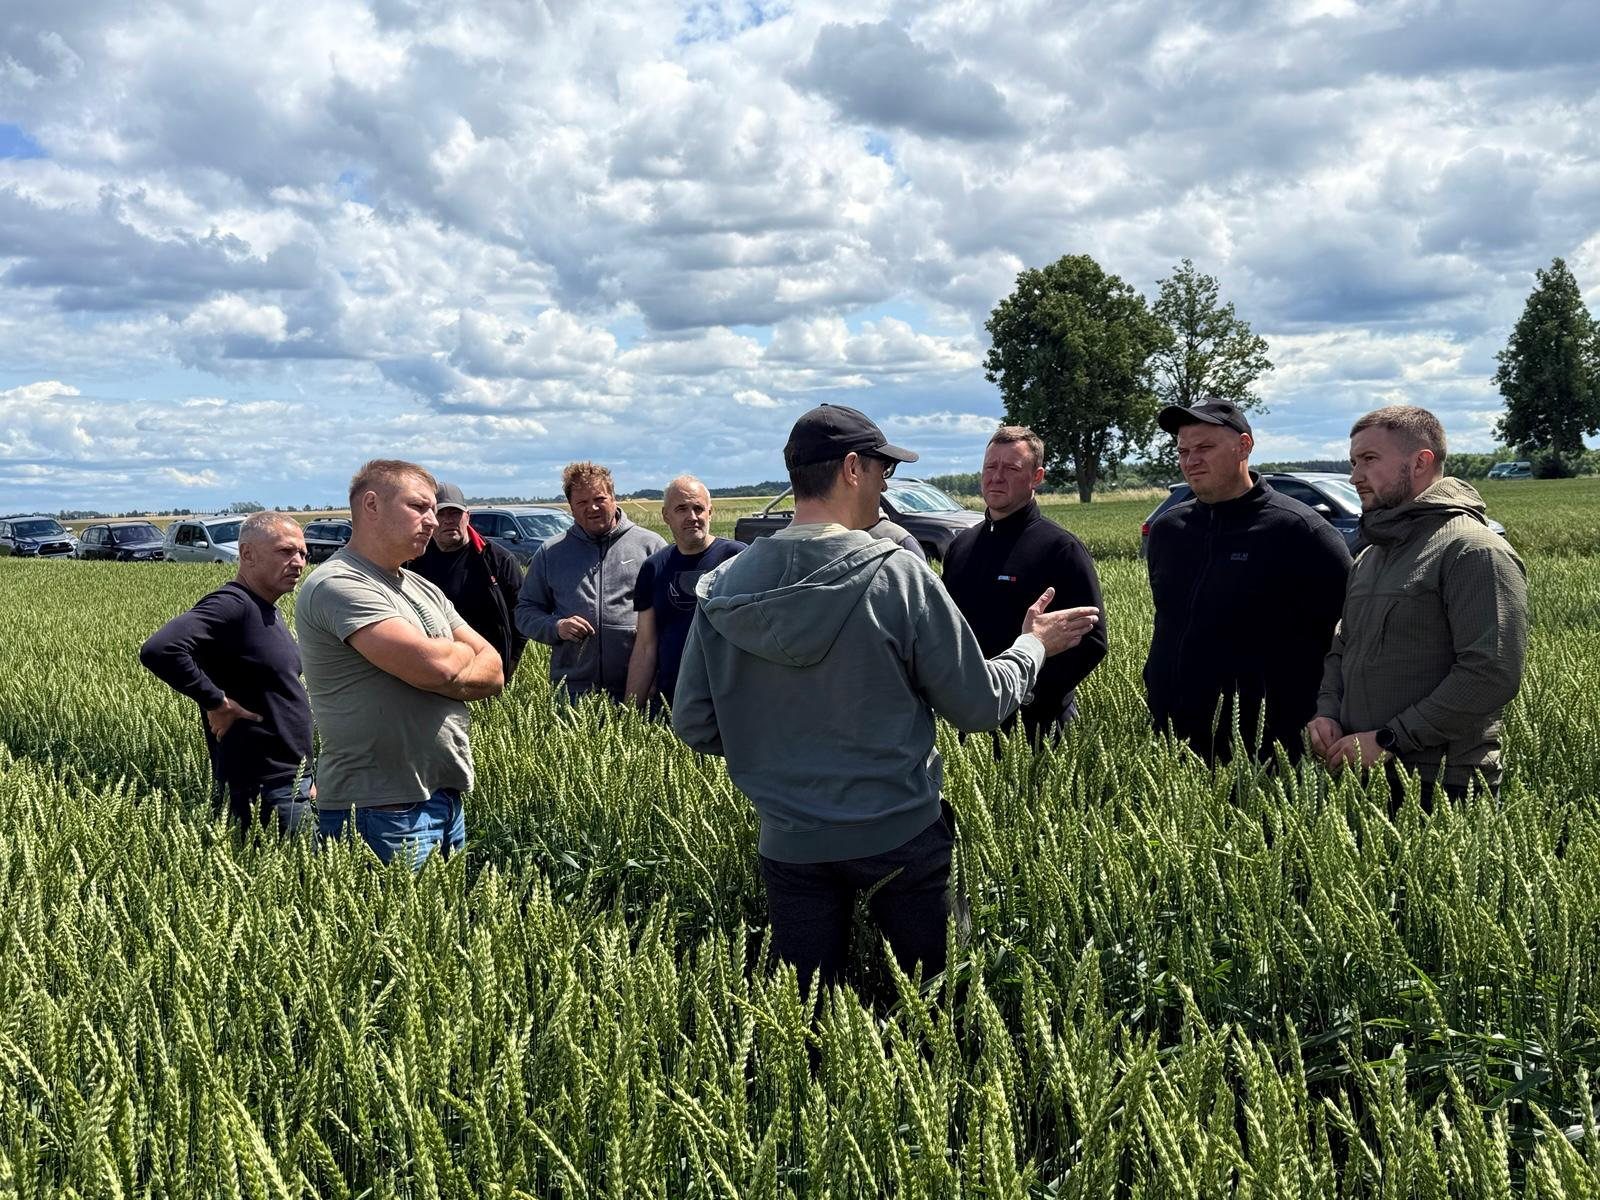
What farmers say
After 5 years of continuous collaboration with Žemdirbių Konsultacijos, my farm has never been better.
Spectral diagnostics helped cut fertiliser costs, and the advice is backed by research.
I used to fertilize my fields based on the recommendations provided by distributors.
After four seasons, yields and finances improved, and the farm started moving to precision farming.
We felt desperate – our knowledge was not enough, local agronomists couldn't help.
Instead of “apply more”, the farm learned to plan fertilisation around what is actually missing.